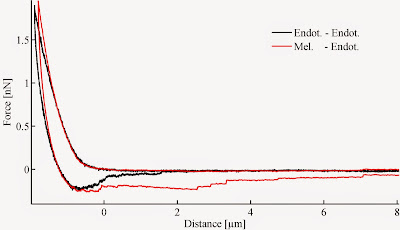
End of silence! Let's roll, and continue with intercellular adhesion. Two important features of a single force curve recorded between two single cells, are the maximal adhesion peak and the separation energy. Both of them is suitable to characterize intercellular binding strength, however sometimes they might contradict each-other. The image below compares two similar force curves recorded bewtween two pairs of endothelial cells and a melanoma-endothelial cells. The maximal force suggests they are equal in binding strength, although if we compare the separation energy (area under the zero force level) the difference is obvious.
As the separation energy is a product of two variables, it might be more sensitive to differences. So, care should be taken when describing a phenomenon. Next time some details on how the binding brokes up. It is interesting indeed. :)
As the separation energy is a product of two variables, it might be more sensitive to differences. So, care should be taken when describing a phenomenon. Next time some details on how the binding brokes up. It is interesting indeed. :)

No comments:
Post a Comment